In Part 2 of this 6-part series, I made the case for applying Decision Science to Portfolio Definition cycle overall. Now, I will delve into the first three MoP Portfolio Definition process steps – Understand, Categorise and Prioritise – in more detail through the lens of Decision Science.
Understand the Decision Context.
The first MCDA step and first phase of Portfolio Definition is to understand the decision context. Existing strategy documentation and corporate plans will help but it is essential that there is a kick-off meeting with senior decision makers and Portfolio Office staff in order to ensure common understanding of the strategic objectives, output and input risks and opportunities, and to baseline the current portfolio (Business as Usual and Change Initiatives). Capability Audits or Gap Analysis will inform this phase. This sets the frame for agreeing the decision criteria and exploring alternatives.
A good set of Criteria[1] should be:
- Complete: criteria completely define the strategic objectives.
- Operational: criteria are meaningful and differentiate the Initiatives in a way that matters.
- Decomposable: the criteria can be analysed one at a time and do not depend on each other.
- Absent of redundancy: criteria are mutually exclusive; do not mean the same thing.
- Of requisite number: sufficient criteria to differentiate the Initiatives, but no more than needed to achieve differentiation. A smaller set also makes the task easier for decision makers.
- Owned by the decision makers.
Criteria represent the ‘why?’ that will assess the added value the Initiatives offer. They must also accommodate preference over time.
Categorise Initiatives with an MCDA Model
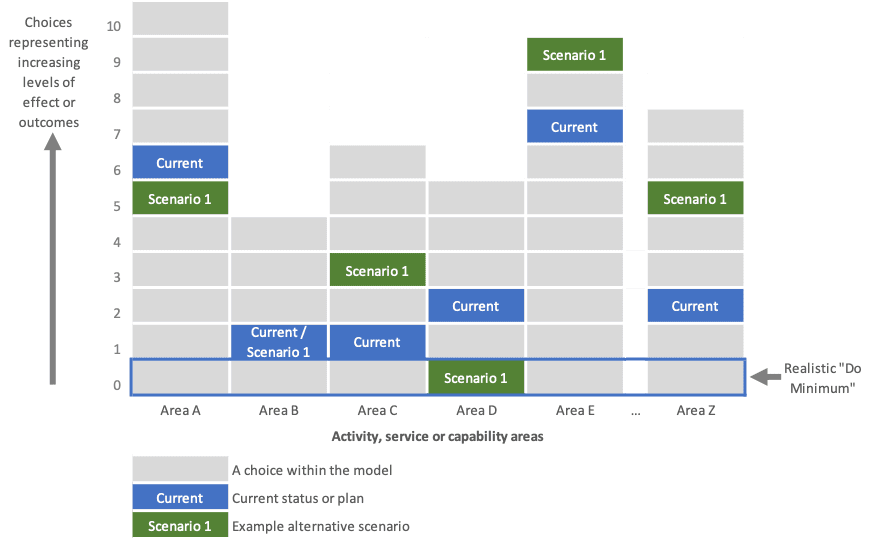
Within a portfolio MCDA model, similar or related Initiatives are typically grouped into Areas. Criteria define different ‘why’; Areas define different ‘what’ the organisation could do. For example, Areas may represent the different services an organisation delivers – see Figure 1 below. Each Level (you can also think of them as options or choices) within each Area would define how, when and to what extent those services are delivered. Other organisations may categorise their portfolio by aligning their Areas to existing programmes, with Levels in the MCDA Model exploring the existing and new implementation plans and programme mandates, or capabilities, geographic areas or other groupings.
The exact construct depends on the organisation, but the generic structure below is a useful aid. Each Level within the Area represents a future state that is achieved when that particular investment is made. As you move up the Area the Levels deliver an increasing degree of effect or outcome. In this example, the Levels are mutually exclusive within an Area (only one Level can be selected from any one Area). Typically, an Area will start with a Level of outcome(s) that are below the current portfolio baseline (or even from a zero baseline) in order to give financial headroom to allow new or innovative initiatives the chance to compete.
Often an alternative approach is used where Areas are cumulative. In the cumulative approach, any combination of individual Initiatives, each represented by a Level in the model, can be selected.

Prioritise by comparing Choices
The principles of MCDA are used within a Decision Conferencing group process to establish the benefit (weighted preference value) of the Initiatives. This is achieved by assessing the Initiatives against a few strategic criteria that represent the organisation’s strategy, the value the organisation delivers, and the fundamental trade-offs being explored. For example, these might represent the short and long-term strategic objectives. The criteria can include both quantitative assessments and qualitative judgements. An MCDA process is applied to break the problem apart into straightforward logical steps by answering a series of scoring and weighting questions. The model can then be used to explore the relative benefit score of the individual Initiatives and the contribution to the overall benefit from each criterion.
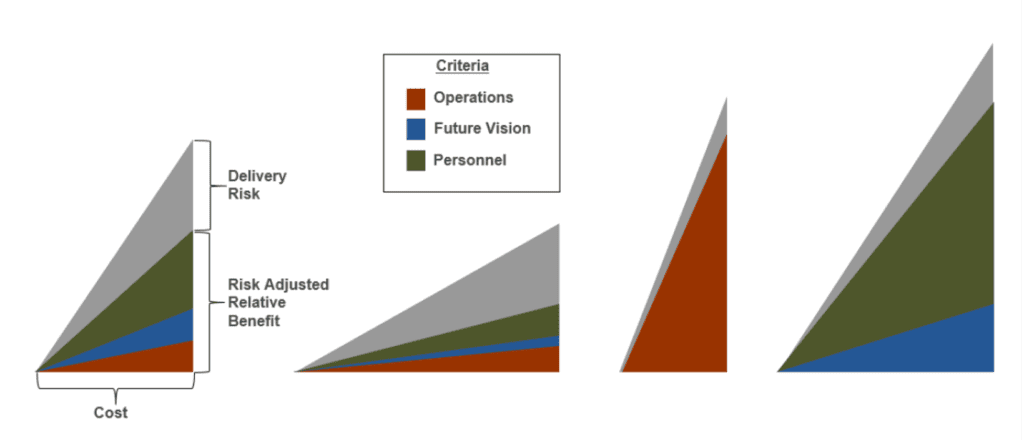
The benefits and costs are then used in combination to prioritise the Initiatives from a value-for-money perspective. Initiatives are ordered by benefit/cost ratio. This is illustrated by triangles below. Each triangle represents an Initiative. The gradients of the triangles are a relative measure of the value-for-money (return on investment) of the Initiatives. As in the illustration, the benefits are often risk-adjusted to capture the likelihood of delivering the benefits on time and to cost and can take into account different types of risk: e.g., technical, skills, industrial, and organisational.

Prioritisation based on benefit only
A question we hear often is “Why not prioritise just on benefit?”. I’m glad you asked…
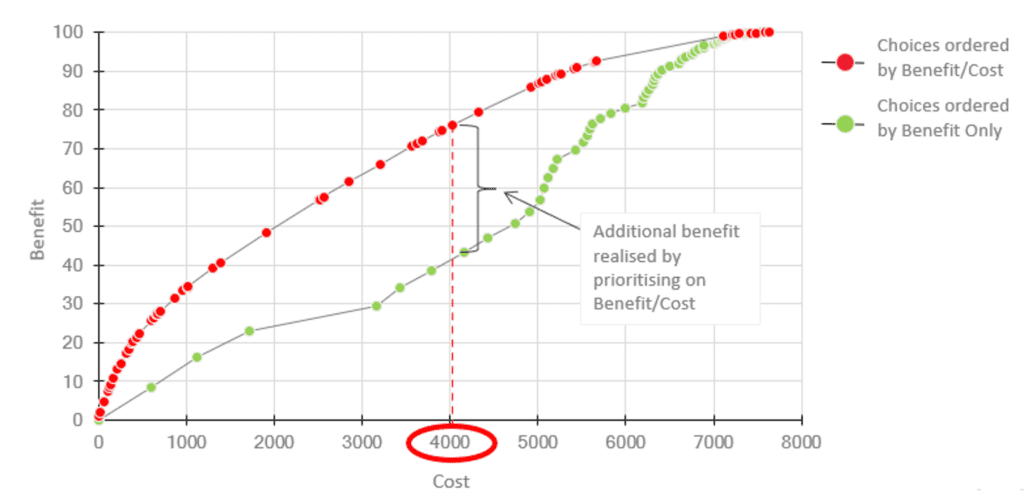
The chart illustrates the cumulative benefit and cost of a portfolio of 59 strategic Initiatives.

These Initiatives (or choices, options) can be prioritised by Benefit Only or by Benefit/Cost
- If the budget is 8000 – all Initiatives can be purchased.
- If the budget is 4000 – then 80% more benefit is realised by funding Initiatives on the basis of Benefit/Cost.
Independent research at LSE has shown that:
“On average 30% additional value is missed if you prioritize on benefits-only”
“Yet most organisations do not prioritise using costs”
Initiative cost estimates only need to be good enough for the purposes of prioritisation, so long as the level of detail is consistent across Initiatives. Detailed costing on large numbers of Initiatives is not needed, particularly if a significant number of Initiatives are not going to be funded anyway. More detailed costing may be required on those Initiatives to be funded before final decisions are made to inform affordability of the portfolio over time.
Next time in Part 4 of this series, I look further into the Balance and Plan steps through the lens of Decision Science.
[1] Adapted from: Keeney, R. L., & Raiffa, H. (1976). Decisions with Multiple Objectives: Preferences and Value Tradeoffs. New York: John Wiley.


Recent Comments